Discover which of your hyperparameters were the best predictors of, and highly correlated to desirable values of your metrics.Documentation Index
Fetch the complete documentation index at: https://wb-21fd5541-john-wbdocs-2044-rename-serverless-products.mintlify.app/llms.txt
Use this file to discover all available pages before exploring further.
Creating a hyperparameter importance panel
- Navigate to your W&B project.
- Select Add panels button.
- Expand the CHARTS dropdown, choose Parallel coordinates from the dropdown.
If an empty panel appears, make sure that your runs are ungrouped
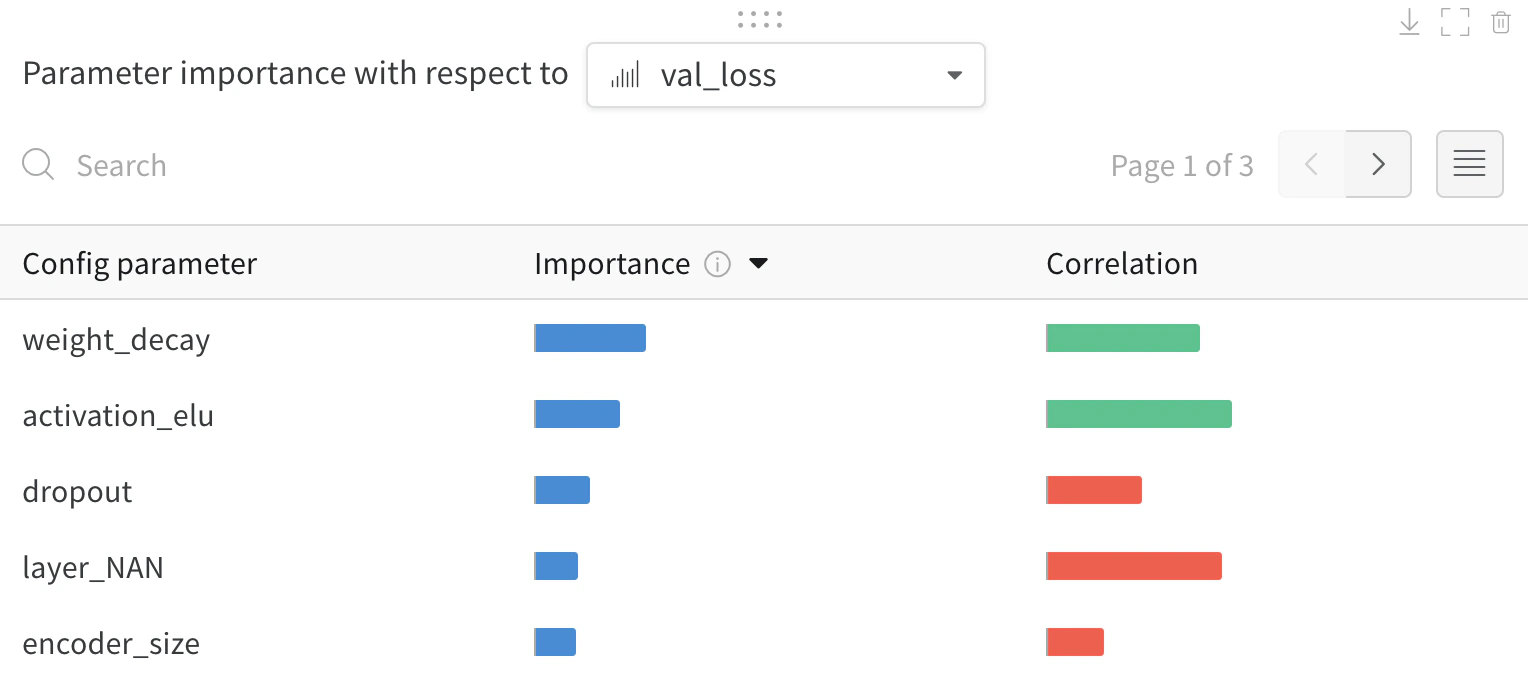
Interpreting a hyperparameter importance panel
val_loss in this case).
Importance
The importance column shows you the degree to which each hyperparameter was useful in predicting the chosen metric. Imagine a scenario were you start tuning a plethora of hyperparameters and using this plot to hone in on which ones merit further exploration. The subsequent sweeps can then be limited to the most important hyperparameters, thereby finding a better model faster and cheaper.W&B calculate importances using a tree based model rather than a linear model as the former are more tolerant of both categorical data and data that’s not normalized.
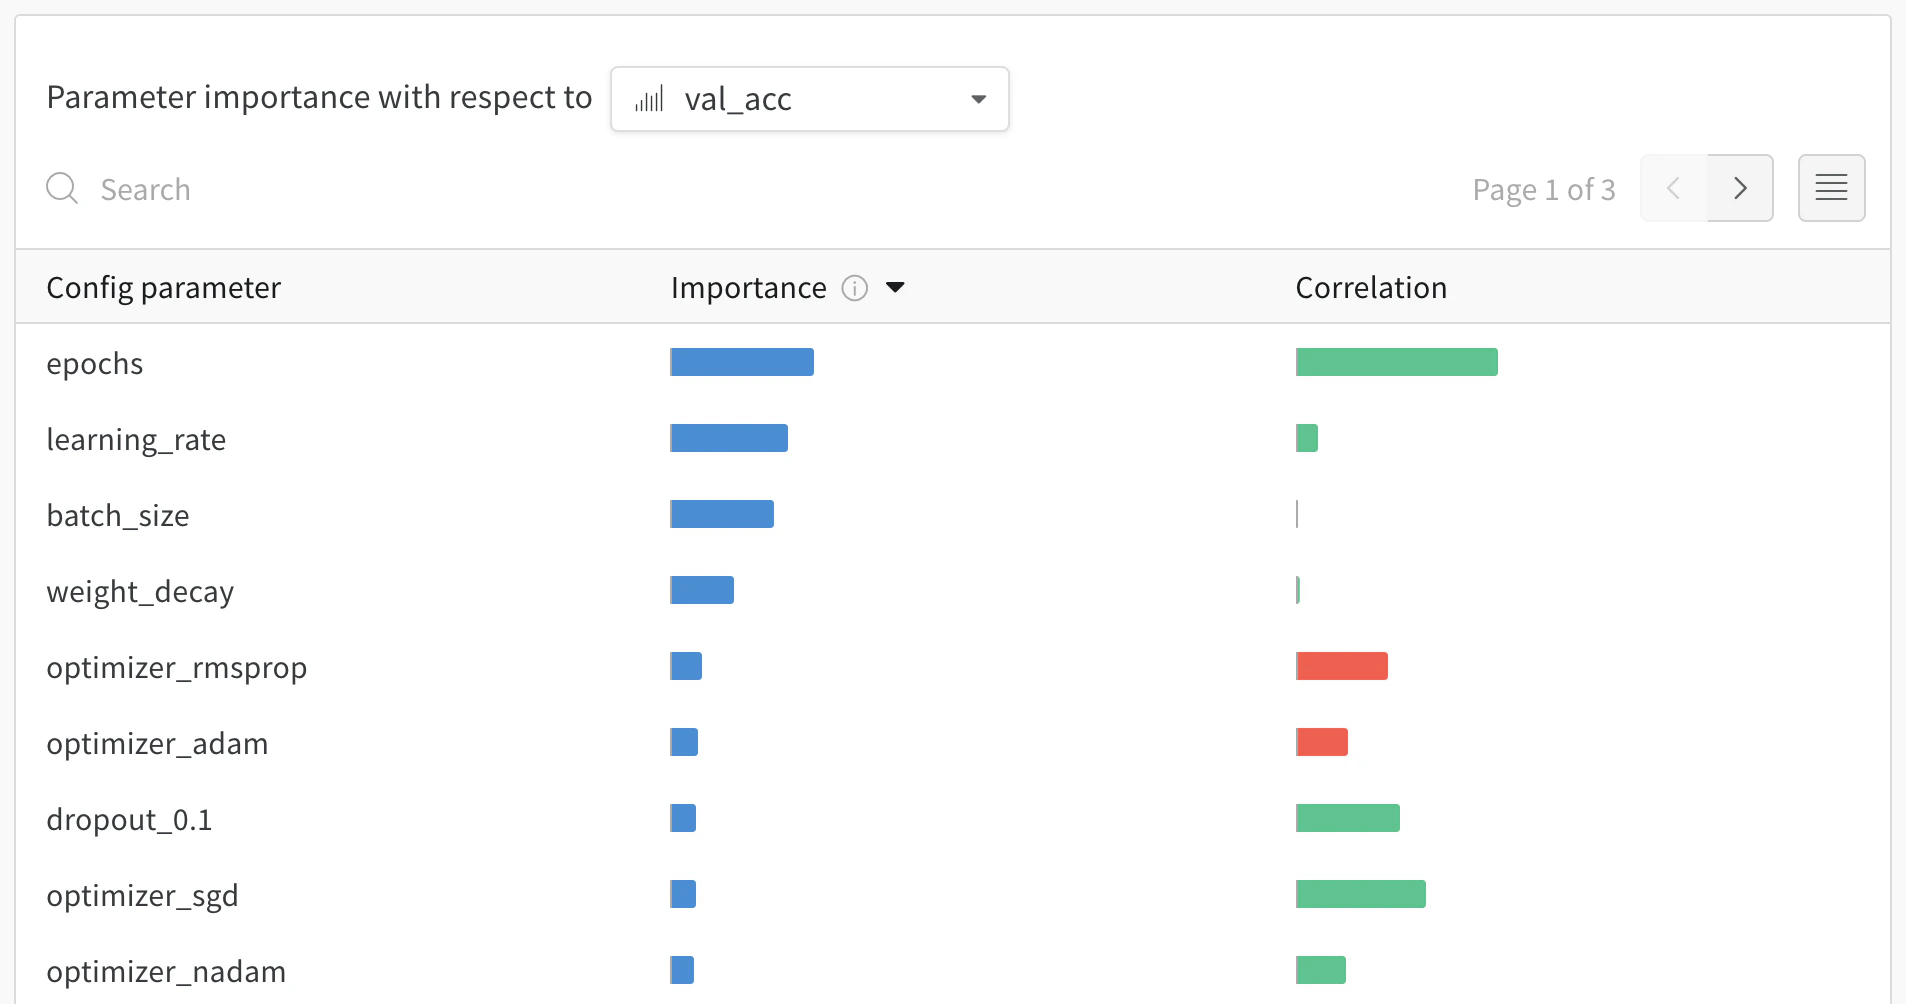
epochs, learning_rate, batch_size and weight_decay were fairly important.
Correlations
Correlations capture linear relationships between individual hyperparameters and metric values. They answer the question of whether there a significant relationship between using a hyperparameter, such as the SGD optimizer, and theval_loss (the answer in this case is yes). Correlation values range from -1 to 1, where positive values represent positive linear correlation, negative values represent negative linear correlation and a value of 0 represents no correlation. Generally a value greater than 0.7 in either direction represents strong correlation.
You might use this graph to further explore the values that are have a higher correlation to our metric (in this case you might pick stochastic gradient descent or adam over rmsprop or nadam) or train for more epochs.
- correlations show evidence of association, not necessarily causation.
- correlations are sensitive to outliers, which might turn a strong relationship to a moderate one, specially if the sample size of hyperparameters tried is small.
- and finally, correlations only capture linear relationships between hyperparameters and metrics. If there is a strong polynomial relationship, it won’t be captured by correlations.