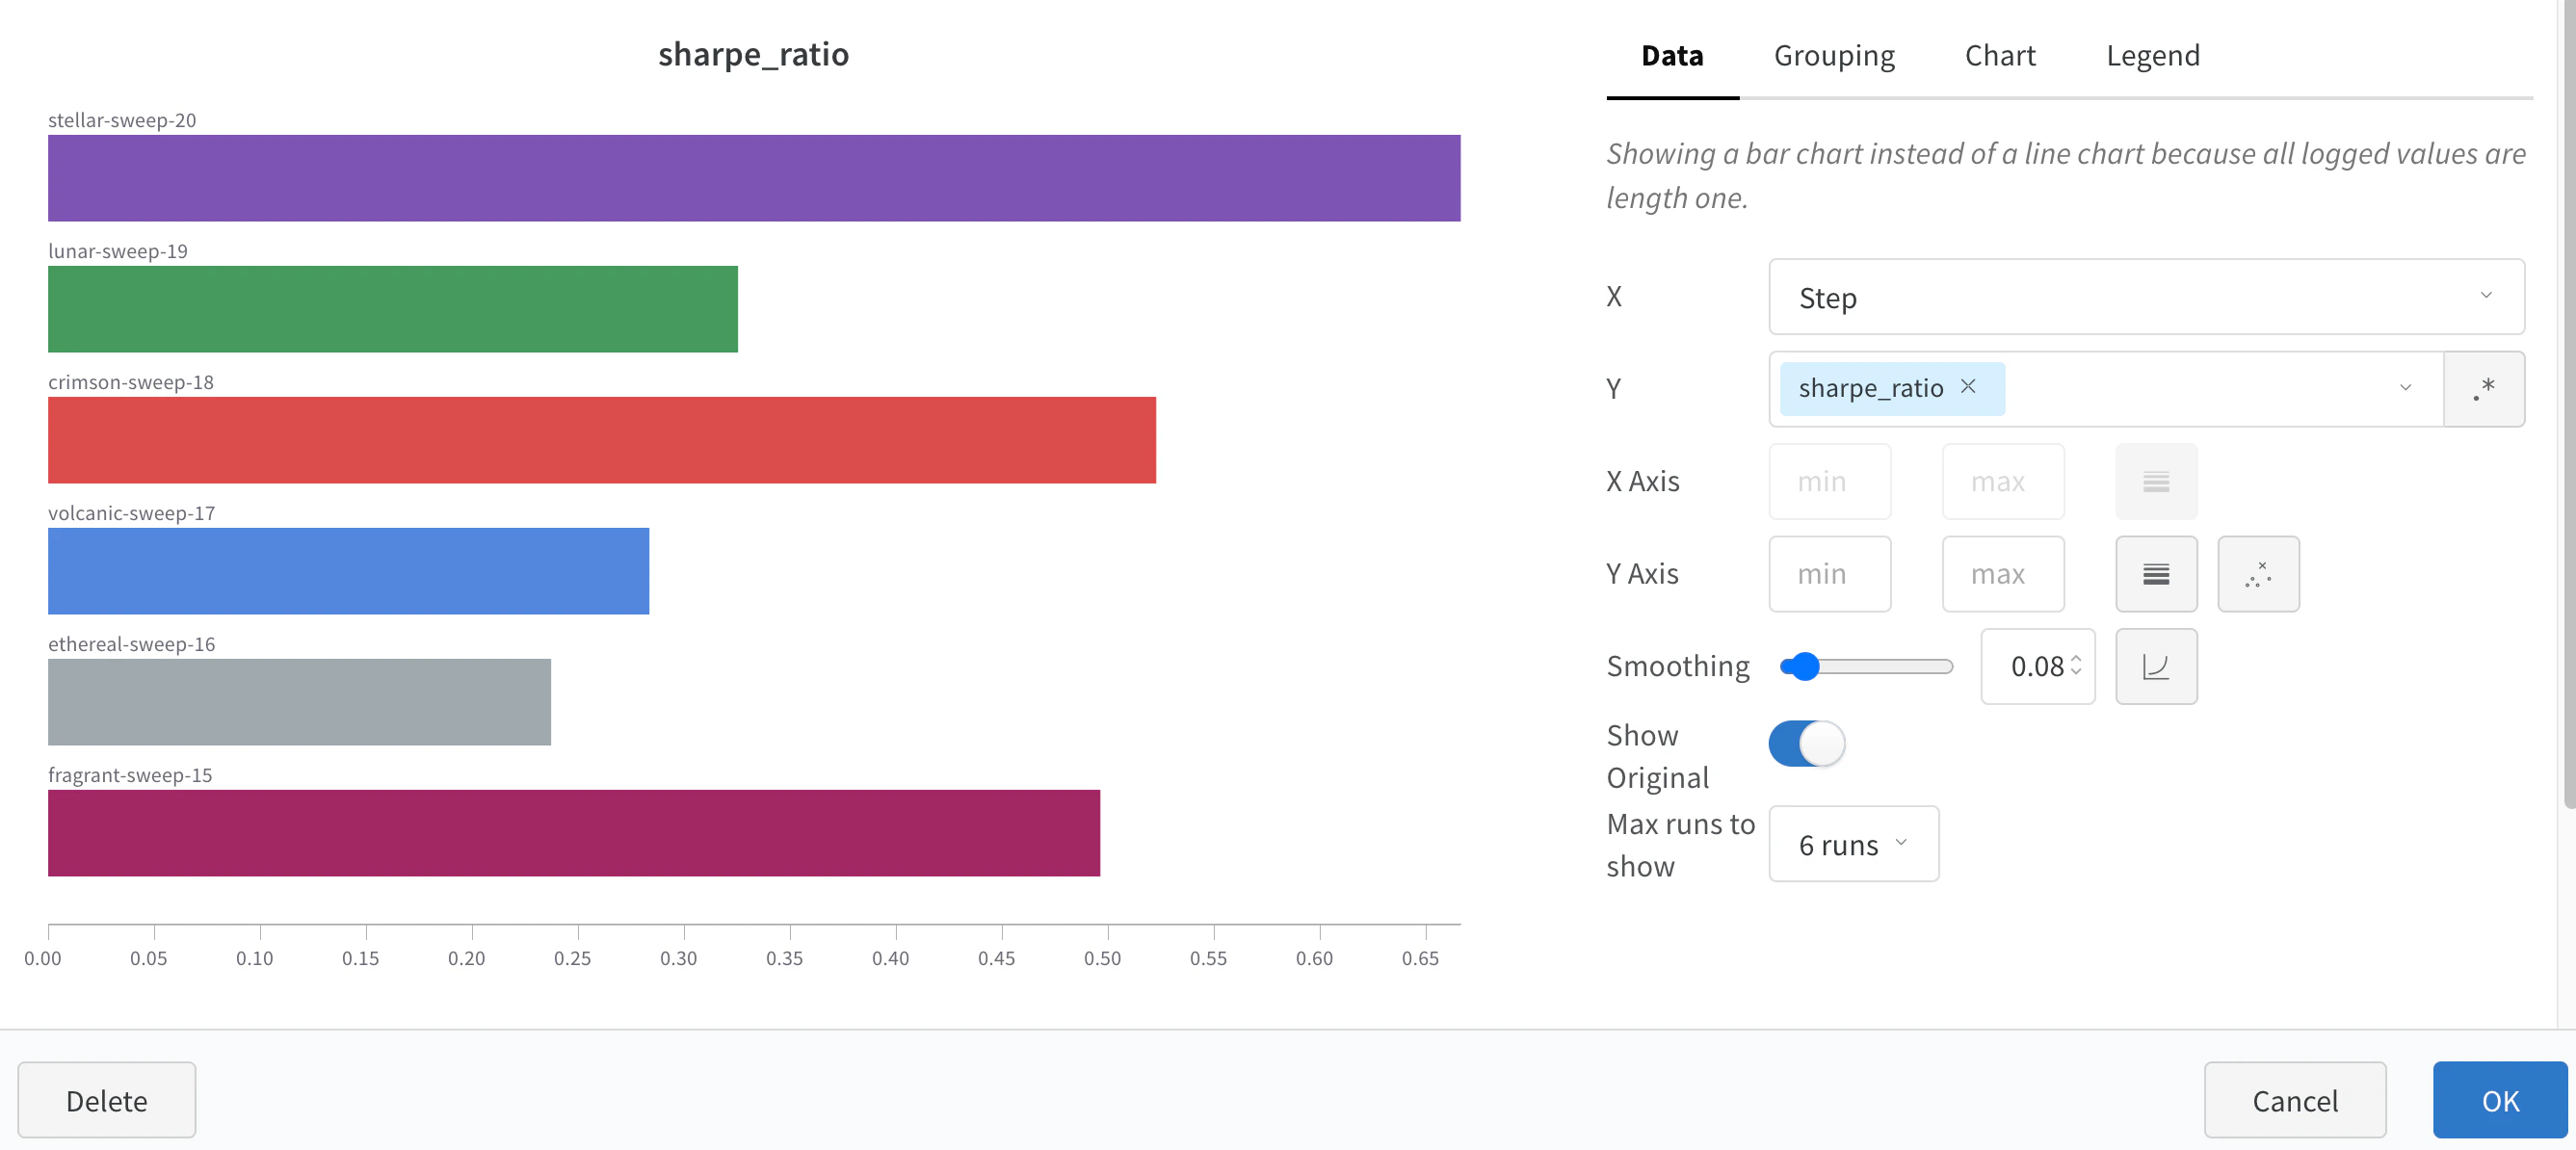
棒グラフは、カテゴリデータを長方形の棒で表すグラフで、縦向きまたは横向きにプロットできます。ログされたすべての値の長さが 1 の場合、Documentation Index
Fetch the complete documentation index at: https://wb-21fd5541-john-wbdocs-2044-rename-serverless-products.mintlify.app/llms.txt
Use this file to discover all available pages before exploring further.
wandb.Run.log() によってデフォルトで棒グラフが表示されます。
棒グラフをカスタマイズする
- Runs table で run をグループ化します。
- Workspace で「Add panel」をクリックします。
- 標準の「Bar Chart」を追加し、プロットするメトリクスを選択します。
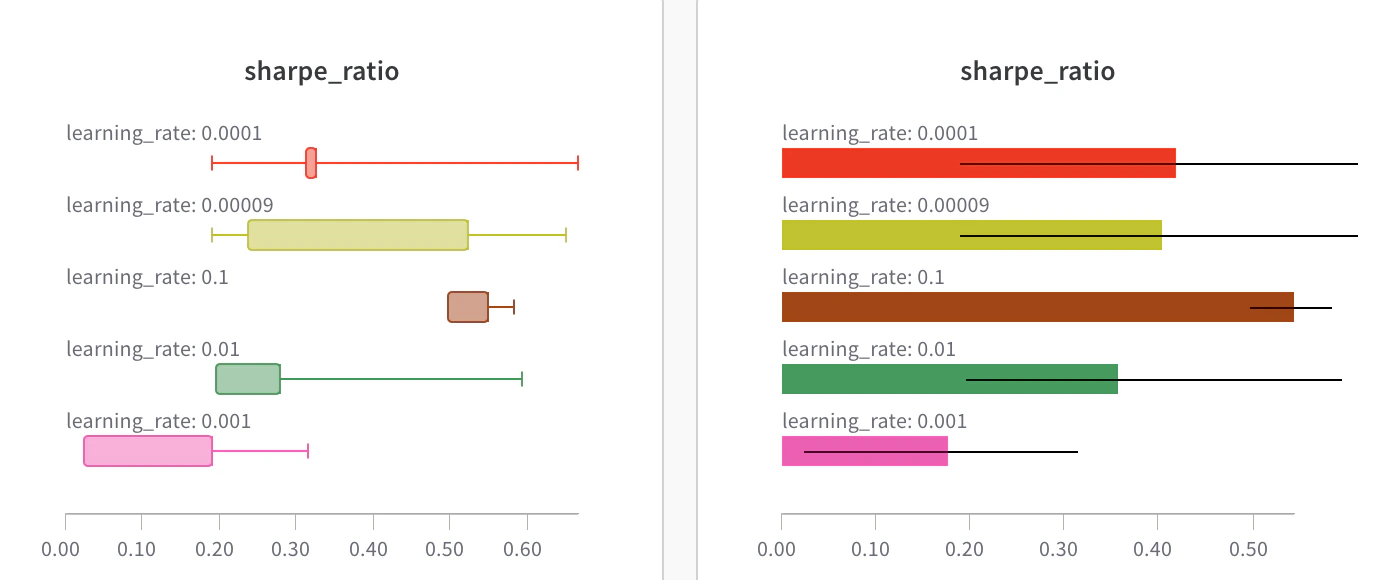
- 「Grouping」タブで「box plot」や「Violin」などを選択し、これらのスタイルでプロットします。